My R package clockplot is now available on CRAN!
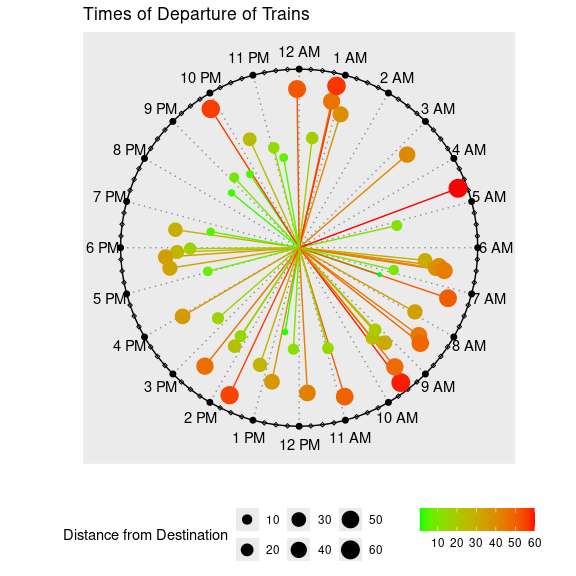
The primary goal of the clockplot is to plot event time on a clock chart. The length and color of the clock hands can be modified by certain qualitative and quantitative variables.
Additionally, the package can make a day chart, a week chart, or a month chart, or plan events in those periods.
I would like everyone to visit the package website (generated automatically by pkgdown), explore the examples, and give wise advice
To see a quick example, see the attached plot. The plot shows times of earthquakes. Points are magnified as per magnitude. Length and color denote the depth of the epicenter. This allows us to find patterns in the event times as well as compare differences in time more easily and usefully than with other charts, such as a bar chart.
Those having a github account, please visit the repo and please give a star :)